Just In Trend
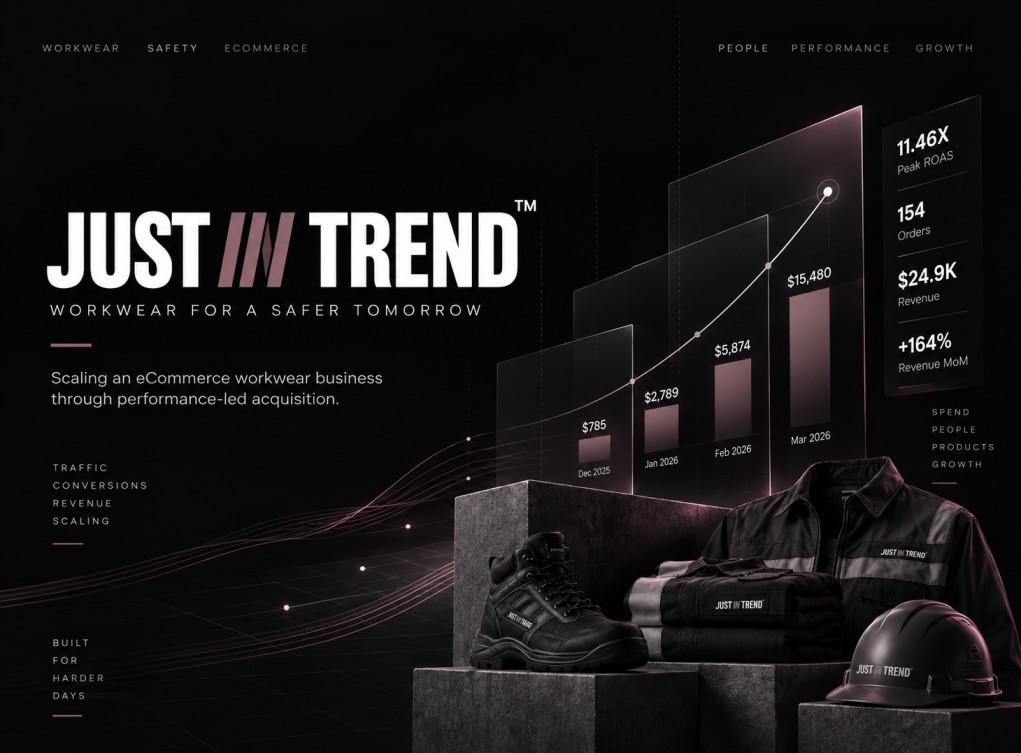
Scaling an eCommerce workwear business through performance-led acquisition. Just In Trend offers FR clothing, flame-resistant workwear and high-visibility safety apparel for the US market. The objective was to build a performance marketing engine focused on revenue, orders and return on advertising spend, while continuously improving campaign efficiency. Google Ads | Meta Ads | Shopping | Performance Max | Remarketing | Conversion Campaigns
THE BUSINESS IMPACT
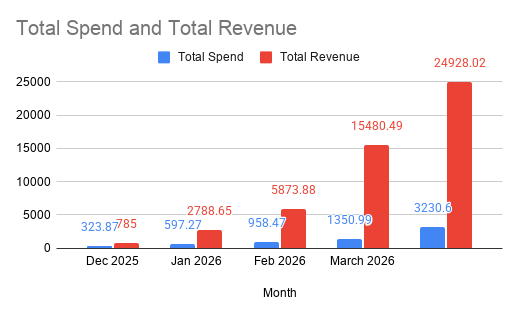
$3.23K SPEND → $24.93K REVENUE
Across the four-month reporting period:
TOTAL AD SPEND
$3,230.60
TOTAL REVENUE
$24,928.02
TOTAL ORDERS
154
AVERAGE ORDER VALUE
$134.99
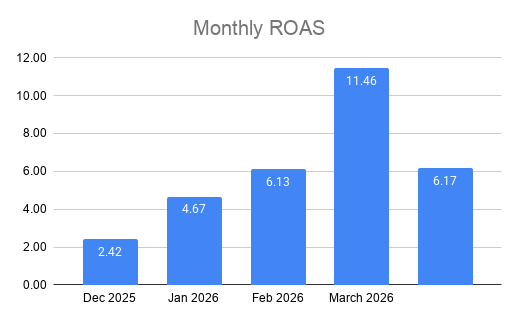
AVERAGE MONTHLY ROAS
6.17X
AGGREGATE REVENUE / SPEND
~7.71X
The 6.17X figure represents the average of the monthly ROAS values.
The aggregate revenue divided by total spend gives approximately 7.71X.
For the case study, these should be kept as two separate metrics to avoid confusing average monthly ROAS with aggregate return.
REVENUE ACCELERATION
Spend increased. Revenue accelerated faster.
JANUARY
Revenue: +255%
Spend: +84%
Orders: +127%
FEBRUARY
Revenue: +111%
Spend: +60%
Orders: +36%
MARCH
Revenue: +164%
Spend: +41%
Orders: +147%
KEY TAKEAWAY
By March, the account was generating significantly more revenue without increasing advertising spend at the same rate. This created room to scale while maintaining strong efficiency.
CAMPAIGN OPTIMIZATION
Budget followed performance
Campaign decisions were continuously guided by: ROAS, Conversion Volume, Revenue, Cost per Conversion, CTR, CPC, Product Performance, and Remarketing Performance.
THE OPTIMIZATION LOOP
Identify weak campaigns → Reduce / Pause → Analyse winning products → Increase budget → Monitor ROAS → Scale
This optimization cycle helped move the account from 2.42X ROAS in December to 11.46X in March.
REMARKETING
Turning existing purchase intent into additional revenue
Remarketing was used to re-engage users who had already interacted with the website or products. A key example was the ATC Remarketing Performance Max campaign.
March Performance
$185.59 Spend
$2,392.51 Conversion Value
12.89X ROAS
22 Conversions
$8.44 Cost per Conversion
Remarketing therefore became an important component of the overall revenue engine.
PRODUCT-LED PERFORMANCE
Letting purchase data guide marketing decisions
The product catalogue included multiple workwear categories:
Flame Resistant
FR Shirts • FR Welding Shirts • FR Denim • FR Pants & Trousers
High Visibility
Hi-Visibility Shirts • Hi-Visibility Coveralls • Safety Workwear
Instead of treating every product equally, campaign data was used to identify products and product groups with stronger purchase behaviour.
PERFORMANCE TRANSFORMATION
From initial acquisition to scalable revenue
DECEMBER 2025
$785 Revenue | 11 Orders | 2.42X ROAS | $71.36 AOV
↓
JANUARY 2026
$2,789 Revenue | 25 Orders | 4.67X ROAS | $111.55 AOV
↓
FEBRUARY 2026
$5,873.88 Revenue | 34 Orders | 6.13X ROAS | $172.76 AOV
↓
MARCH 2026
$15,480.49 Revenue
84 Orders
11.46X ROAS
$184.29 AOV
MY ROLE
Performance Marketing & Growth
Paid Acquisition
Google Ads • Meta Ads • Shopping • Performance Max • Search • Remarketing
Campaign Management
Campaign Strategy • Product Segmentation • Budget Allocation • Audience Testing • Campaign Optimization • Scaling
Performance Optimization
ROAS Analysis • Revenue Tracking • Conversion Analysis • CPC / CTR Optimization • Product Performance Analysis • MoM Reporting
Growth
eCommerce Revenue Growth • Order Volume Growth • Average Order Value Improvement • Retargeting Strategy • Budget Scaling
THE RESULT
Turning performance marketing into measurable revenue
Over the four-month period, the performance marketing program scaled from an initial 2.42X ROAS to 11.46X ROAS.
Monthly revenue increased from $785 → $15,480.49, monthly orders increased from 11 → 84, and average order value increased from $71.36 → $184.29.